
This is a fuller version of an article which appeared in the October 2020 edition of the Journal of the British Astronomical Society (JBAA: 130, 5, p273-284). It contains extra information, analysis and supporting images which unfortunately space did not allow for in the Journal article.
This is now much more up-to-date article, which now replaces the older but previously much-visited Mars edge-rind article which has some inaccuracies but which can be found archived here.
Created Oct. 5th 2020 – Updated March 7th 2022
The edge-rind artefact is a spurious defect commonly affecting the appearance of the sharper limb of Mars in digital images. Although frequently seen, very little has been written about its appearance or cause. This webpage article is an attempt to remedy this. It proposes that the artefact is primarily a diffraction effect, whose severity is related to the relative visibility of the Airy disc pattern, and accentuated by contrast-enhancing processing methods commonly used in planetary imaging. The artefact is possibly modified by effects such as variations in seeing, tube currents, optical aberrations or misalignments, as well as the presence of albedo regions ‘hidden’ at the edge of the planet.
Introduction
Over the last 20 years or so, digital video imaging has developed to become the leading method for recording planetary detail, allowing amateurs to record levels of detail impossible with film photography and often surpassing those seen by the best visual observers. The method uses a video camera to capture streams of hundreds or thousands of short-exposure digital frames of a target planet. The sharpest frames from these videos are later aligned and stacked to produce a single master frame, where much of the blurring effect of our atmosphere is reduced or averaged out. As the final stack is effectively a very long-exposure image, the noise levels in this master are very low. This allows it to be stretched and sharpened to draw out surface detail without the image suffering unduly from noise issues. In this way, wonderful Earth-based images can be produced of our near neighbours in space.
More recent advances in camera technology and sensor design have led to reductions in levels of image noise and to improvements in image resolution and fidelity. Spurious image artefacts, often originating in the cameras or sensors and a common part of early digital imaging, are now thankfully rarer. Even so, images of the planet Mars continue to be afflicted by a noticeable spurious edge defect, which has been seen since the early days of digital video imaging. This paper discusses the appearance and cause of this persistent effect, which will be referred to as the ‘edge-rind’ artefact.
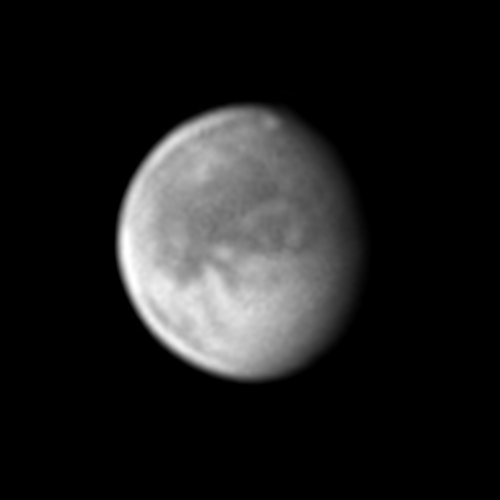
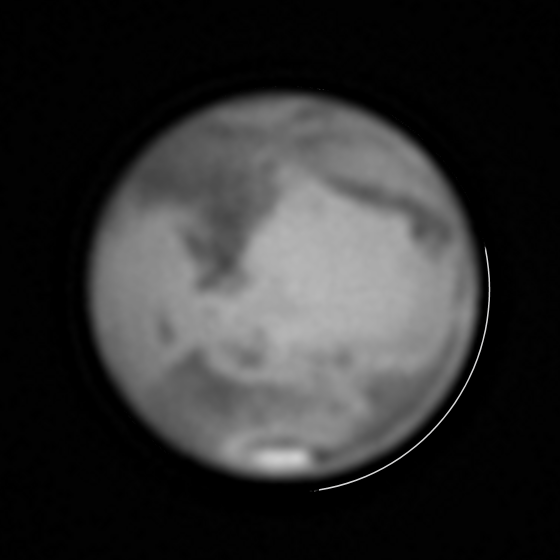
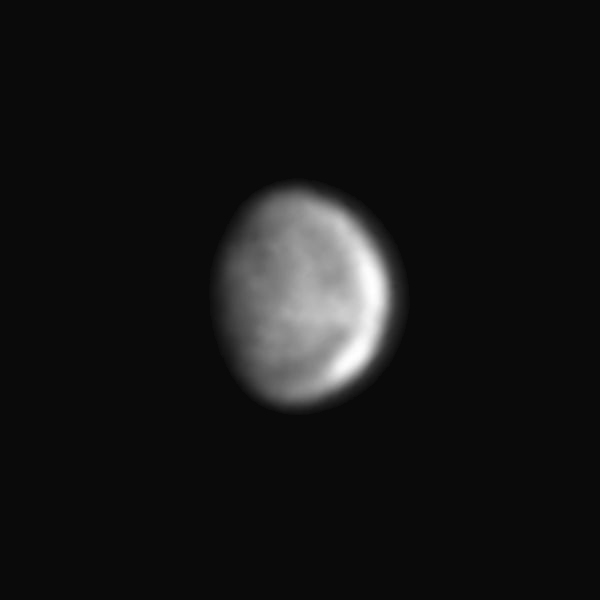
The Mars edge-rind artefact consists of a narrow darker arc running concentrically with the limb, just inside the sharper non-terminator edge, often occurring in conjunction with a brightening of the region between the arc and the edge of the planet. Examples of a typical edge-rind are shown in Figures 1a, 1b & 1c.

Although most commonly seen on images of Mars, the artefact can quite often be seen in a similar form on those of other planets. Mercury can be particularly badly affected, due to its hard edge, small angular size and the fact that it exhibits phases – all of which seem to exacerbate the effect (see Figure 1d).
Other digital video image artefacts
In certain circumstances, other types of edge artefact that may be confused with edge-rind can be seen on Mars images. Many of these are chip- or electronic circuit-related – occurring due to electrical ringing or reflection effects at abrupt signal changes, and exacerbated by poor electronic filtering design.

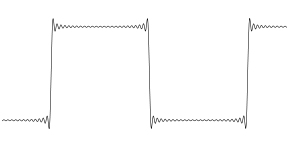
Often such electronic ringing effects relate to the Gibbs phenomenon, where a sharp transition can lead to overshoot and the production of sinusoidal variations in an analogue signal at that transition.
In the early days of high-speed video imaging of the planets, one would often come across spurious edge effects that were related to particular cameras or chips and such issues are still to be occasionally found in commercial cameras today. Usually problems occur when cameras are operated with insufficient gain or low image brightness, but sometimes they become apparent when frame rates are too high.
The first of these artefacts that the author came across was the ‘offset ghost’ artefact that used to be seen in cameras having the popular Sony 098 chip and running at the highest frame rate of 60fps. This chip-related artefact was a ghost image seen 11 pixels to the right of any abrupt edge. In Figure 3a, the artefact shows as an arc rather than a concentric ring as it is the same diameter as the planet. Dropping the frame rate to 30fps made this artefact disappear completely.

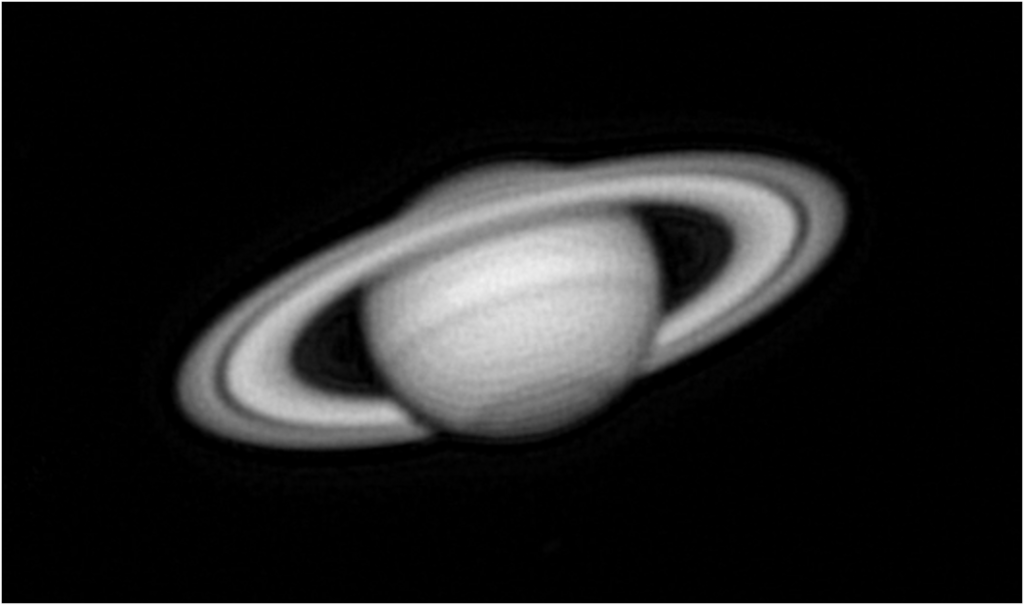
A similar looking defect is seen in Figure 3b which shows a dark arc on the right hand side of Saturn in an image taken by Anthony Wesley using a Sony ICX274 quad readout chip. Anthony reports that the side of the planet the shadow was on depended on which side of the chip the image fell.

Another chip-related offset artefact is shown in Figure 3c, for a Skyris 445C camera having a Sony ICX445AQA chip. Again this artefact is related to frame speed, appearing at 30fps but being absent at lower speeds.
Other edge artefacts related to gain and brightness settings can be occasionally seen. One such defect is the so-called ‘onion skin’ artefact (Figure 3d), which arises when the video has been recorded at too low an image brightness. The failure to use a good proportion of the full dynamic range of the 8-bit camera (256 levels) means that there are too few grey levels to render the planet in a smooth manner. As a result, it shows a characteristic concentric ring texture, whose shape can be influenced by the brightness distribution on the planet.
The same ‘onion skin’ effect is seen in Figure 3e below in an image by South African imager, Tiaan Niemand, using a NexImage5 camera. Again this is likely due to insufficient image brightness.
Similar concentric ring artefacts can appear when the image brightness is sufficient but the gain is too low. In Figure 3f, we see another example of an ‘onion skin’ type of artefact. Again this is on a Skyris 445C camera and this particular example was caused by insufficient camera gain. The image was taken with a camera gain of 14dB gain (of 30dB max.). A gain of >20dB on this camera completely eliminated this artefact even though in both cases the image brightness and number of grey levels was the same.
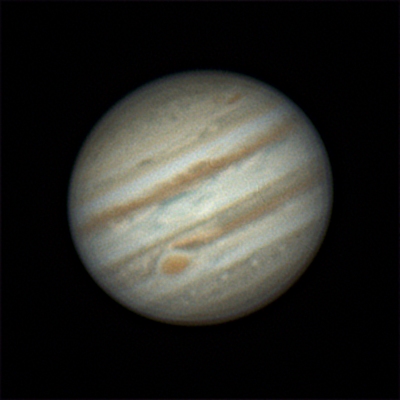
Figure 3g shows another example with a Skyris 132M camera with a gain of 50%. Gains of >60% eliminated this effect but unfortunately then led to issues of fixed pattern noise across the whole image!
Main characteristics of the edge-rind artefact
The artefacts discussed in the previous section relate to particular cameras or chips and camera settings. The edge-rind artefact, however, is far more universal and persistent, its prevalence being the cause of ongoing frustration amongst Mars imagers. The artefact cannot be eliminated by just changing camera settings or camera model and this tells us something about its cause – it must be far more fundamental.
It is useful here to outline the key characteristics and dependencies of the edge-rind artefact, helping to give us clues as to what its cause might be.
Constant angular width
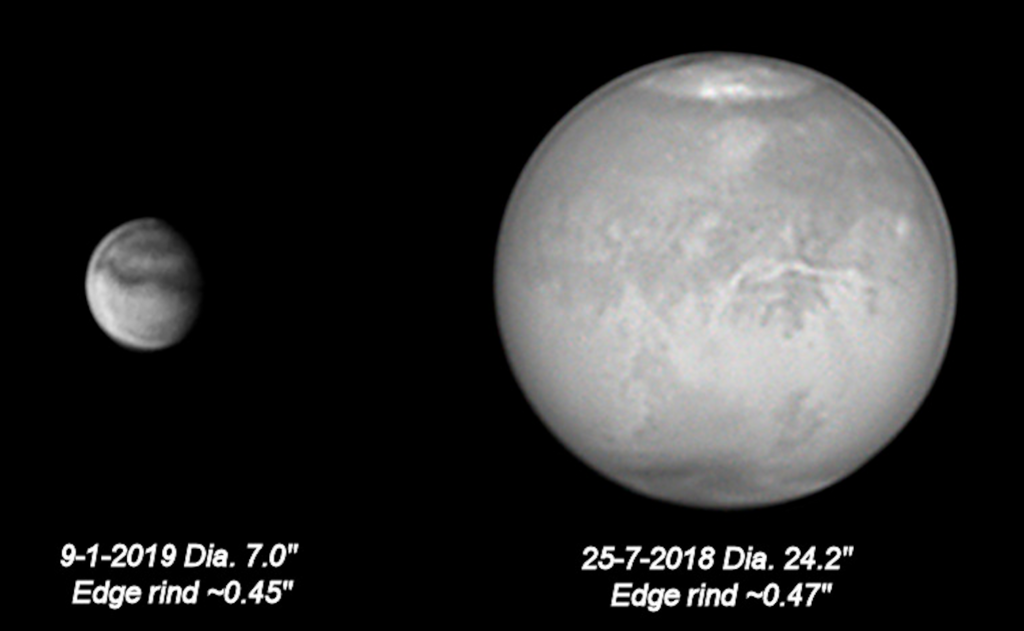
Observation shows there to be little or no dependency of the angular width of the edge-rind artefact on the angular diameter of the ‘host’ planet – this width stubbornly stays the same as Mars’ diameter changes, provided that the telescope and wavelength used to image the planet stay the same. As Mars retreats and shrinks, the relative size of the edge-rind increases because its angular size is maintained (see Figure 4). As a result, the effect becomes even more of a distraction as it affects a larger and larger fraction of the planet’s diameter.
The constant angular width of the artefact means that for different optical amplifications on a given night, the ratio of the edge-rind width to the planet diameter stays the same. This behaviour is illustrated in Figure 5, where altering the choice of Barlow lens makes the planet shrink to 60% of the original diameter on the chip and the edge-rind subsequently changes by the same factor. Such directly proportional behaviour might not be expected if the cause of the edge-rind was a ringing effect in the chip/electronics, arising from the abrupt change in signal associated with the edge of a bright disc.

Rind location versus terminator location
When away from opposition, the artefact always lies along the sharper Martian limb opposite the softer terminator. On this side there is a more abrupt transition from the bright limb of the planet to the dark sky background.
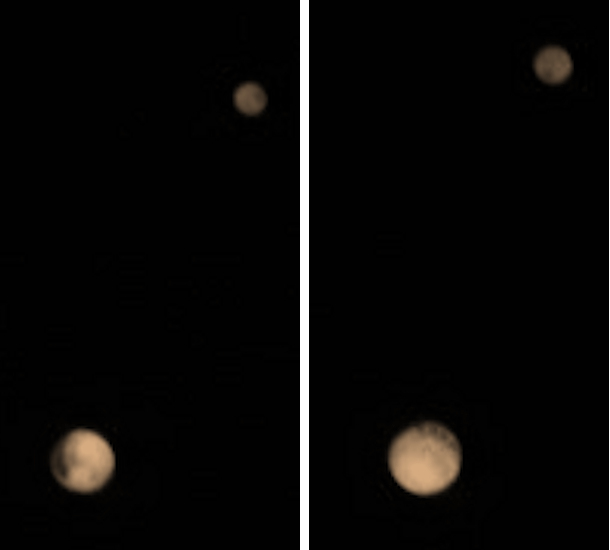
When Mars is close to opposition the limb is sharp all the way round and then the artefact may be seen to occur at any position. Such behaviour is seen clearly in Figure 4 – the image on the left is a month after eastern quadrature, whilst the image on the right is two days from opposition.
Wavelength dependency
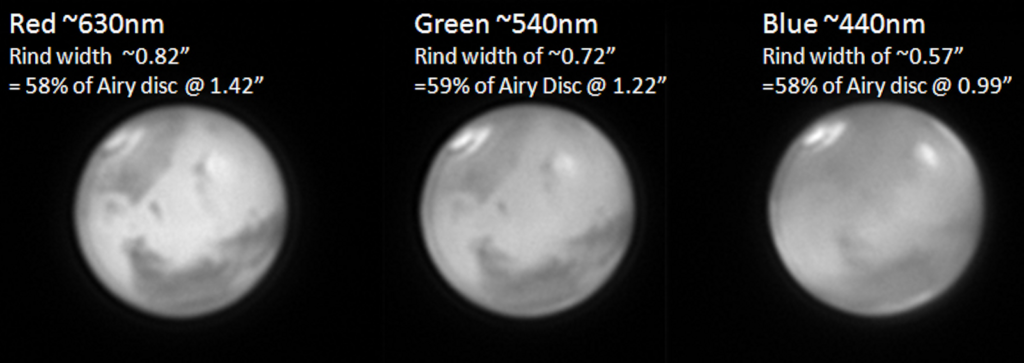
A noticeable characteristic of the edge-rind is that the artefact is generally most evident in the red and infrared wavelengths, and less evident at shorter wavelengths. Not only is the intensity quite often stronger at the longer wavelengths, where seeing effects are less evident and the image is thus generally sharper and at higher contrast, but the width of the rind is invariably greater at these wavelengths too. The analysis seen in Figure 6a and 6b shows that the width of the edge-rind, from limb edge to the middle of the dark arc, seems to change in direct proportion to the imaging wavelength.

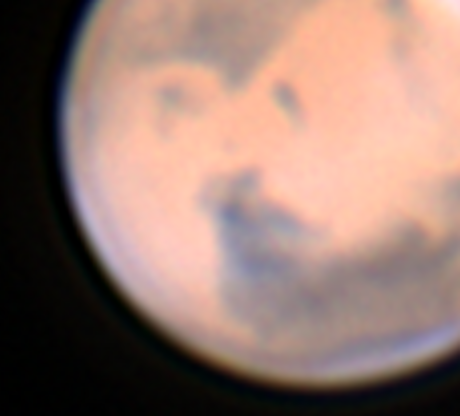
When using a mono camera, imaging through single red, green, or blue colour filters, any edge-rind is seen as a dark arc whose distance from the sharp limb is related to the average wavelength of the colour filter used. If these separate red, green and blue images are later combined to create a full-colour image, the different dark-arc- to-limb separations for each colour can lead to colour fringing. An example of this is shown in Figure 7. If imaging with a one-shot colour camera, which has colour filters of a much wider bandwidth, the greater range of wavelengths can lead to softer, wider dark arcs at each colour. This may lead to less colour fringing, but the increased overlap can make the overall dark arc more obvious in the full-colour image.
Wavelength-dependent diffraction effects are fundamentally part of astronomical imaging. A star observed at best focus in a telescope is not a point source – instead, diffraction causes it to be seen as a small disc surrounded by concentric dark and light rings of decreasing brightness. This is the so-called Airy pattern seen in Figure 8a.

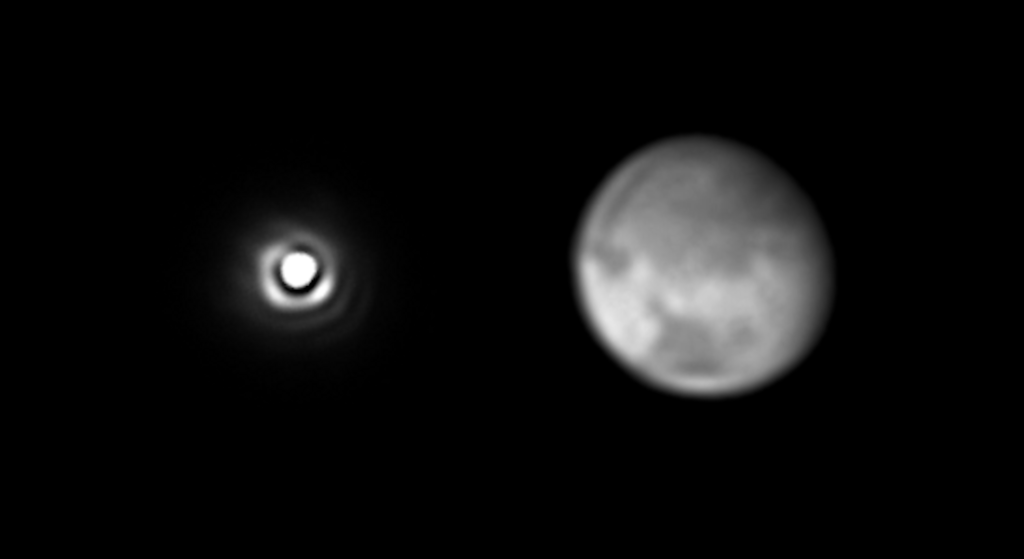
The angular size of the central Airy disc in radians (d) depends on the wavelength (λ) and diameter (D) of the telescope’s aperture, linked by the simple relationship d= 2.44λ/D. Empirically the width of the edge-rind, measured from the limb to the middle of the dark arc, appears to stay a fixed ~60% of the telescope’s Airy disc diameter (taken as the diameter of the first dark ring). In Figure 8b we see a direct size comparison between a star’s Airy pattern and edge-rind width. Both images were taken with the same telescope, on the same night, and are presented at the same image scale.
Aperture dependency
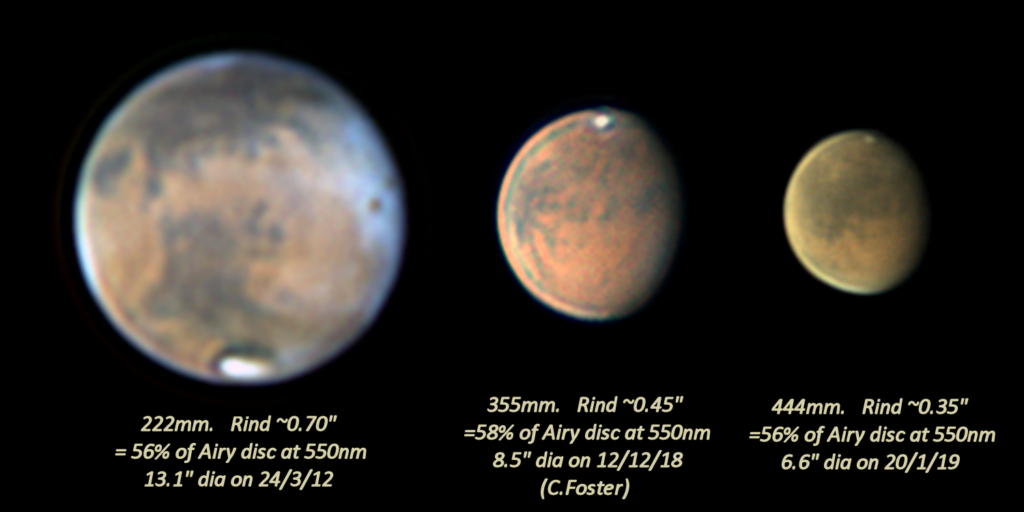
Another key observation of the edge-rind artefact is that its angular width is aperture-dependent – the width decreases in inverse proportion to the aperture. Halving the aperture doubles the edge-rind width. As a result, smaller telescopes are generally much more troubled by edge-rind than large telescopes, due to the comparatively wider rind width.
Figure 9 illustrates this with images taken by different observers and through telescopes of different apertures, but presented at the same image scale. Although the images are taken at different times, with Mars at different diameters, this does not matter when exploring this dependency, as we have already seen that the angular width of the rind is independent of the true angular size of Mars at any time.
Secondary dark arcs & external bright arcs
The Mars edge-rind can be a single dark arc, inside the limb and concentric with it. Often, however, this arc can be broken into several separate sections of different intensities.
If the edge-rind is particularly bad during a session other features may also be seen, some of which are bright rather than dark; these are shown in Figure 10. Occasionally bad edge-rind is associated with the secondary dark arcs seen at top left in Figure 10, inside and concentric with the main arc. Faint brighter arcs can be seen sited just outside the limb of Mars – these are often more intense in the part of the limb where the arc is absent.

Changing location & severity
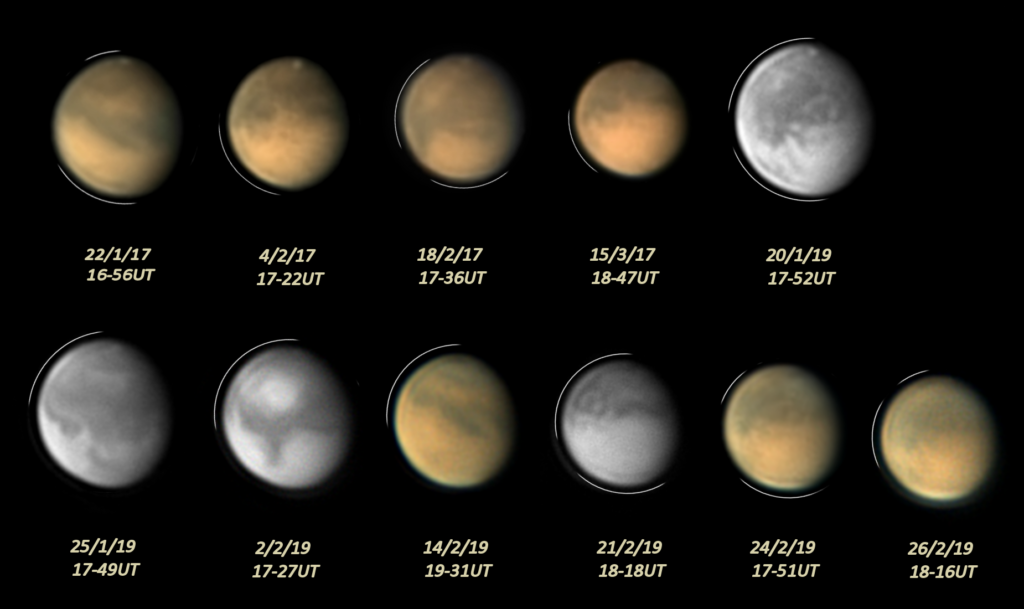
The changing nature of the edge-rind severity is a final characteristic worthy of discussion. On some occasions the edge-rind is very strongly present, whilst on other days with the same instrument, camera, wavelength etc. it is almost entirely absent, as seen in Figure 11.

We have already spoken of the often broken nature of the edge-rind arcs on Mars, where some areas of the limb are affected whilst other areas are clear. There is usually some stability in the angular positions of these arcs within an imaging session, and quite often session-to-session – although the relative visibility of the arcs may vary (Figure 12).
Edge hardness & the impact of processing
Several possible explanations for the cause of edge-rind have been proposed in the past, including chip-connected issues, particular types of seeing, and a diffraction-related effect. Before deciding which the evidence best supports, it is worth understanding how common processing methods used by planetary imagers can introduce edge effects that might play some part in the visibility of the edge-rind.
Standard planetary image processing methods are designed to enhance subtle details present in the raw image, and consequently will boost the contrast of any edge-rind that might be present in it. As shown in the following, however, such methods also have the potential to introduce bright and dark edge effects where previously none existed.
In Figure 13 is shown a composite of real and synthetic test images. It shows the effect of a fixed, fairly typical processing regime using wavelets in Registax 6,1 acting on two Mars images which have been taken with a 444mm reflector. The same processing has also been applied to sets of synthetic reddish discs created in PaintShop Pro and having different degrees of edge fall-off. As you can see, the processing has nicely brought out the detail in the two Mars images, but also brought out bad edge-rind in the Feb 20 image, although we see none in the Feb 25 image. Below these actual Mars images are the computer-generated discs of 100 and 200-pixel diameters, to which this same level of processing has been applied. Some of these are hard-edged and some have two pixels of Gaussian blur, added to soften the edges and mimic possible image softening caused by some types of seeing, poor focus etc. There is also a version of the 100-pixel disc with four pixels of Gaussian blur.
It can be seen in Figure 13 that the same level of processing used on the top two Mars images has brought out a bright edge on the synthetic discs lower down. The intensity and width of this bright edge depends on the softness of the edge of the original synthetic disc and seems to be independent of the disc diameter. For experimental purposes, the first two artificial discs in the set also have a second, higher degree of processing applied (‘process B’ where the sharpening level has been increased from 0.15 to 0.3). You can see the effects of this stronger processing on the extreme right-hand-side of the diagram. This higher level of processing (which would have made Mars look severely over-processed) has, not surprisingly, increased the intensity and width of the induced bright edge. Further down, there are two examples where noise has been added to the artificial discs. The processing just amplifies the noise, having little effect on the edge structure. In the last two tests limb darkening has been applied – first with no blur, then with two pixels of blur. This results in a quite complex edge after processing, with a bright external ring, a darker inner ring and a wide, soft and slightly brighter ring inside that.

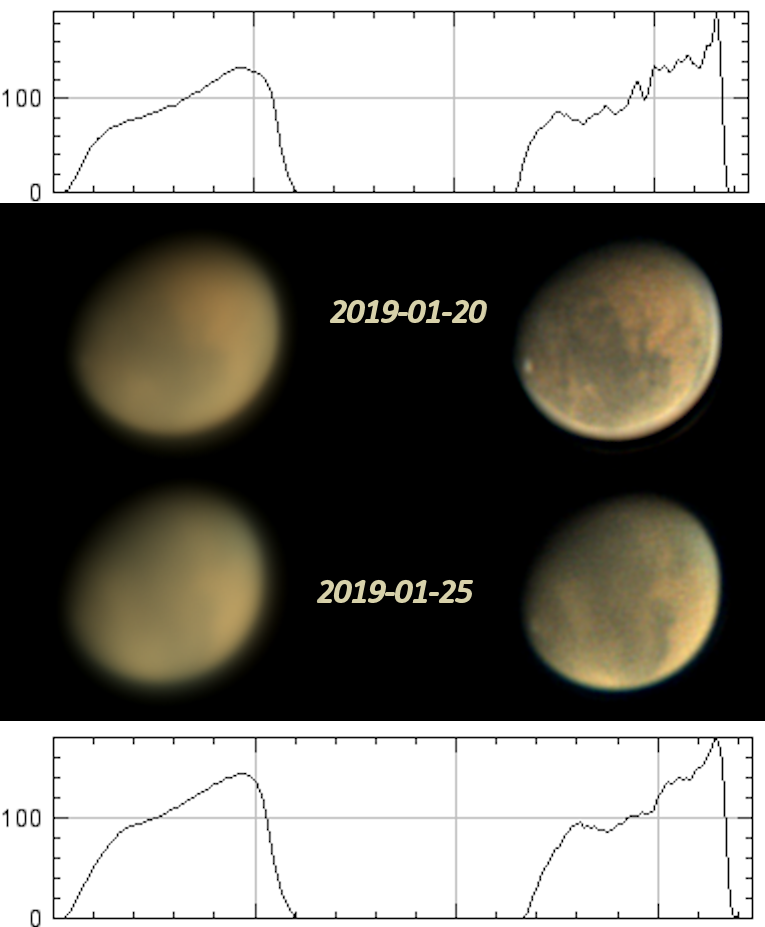
To understand how the abruptness of the edge might influence the visibility of the edge-rind, and maybe how later processing might draw it out differently, it is interesting to return to the two Mars images at the top of Figure 13 and re-examine the brightness profiles across the raw and processed discs in the direction of the worst rind. This is shown in more detail in Figure 14. As expected from the tests above, processing has preferentially increased the brightness of the harder, right-hand, sharp limb edge. Surprisingly, however, although the image of 2019 Jan 20 shows edge-rind and that of 2019 Jan 25 seems to be free of it, there are only subtle differences in the two brightness profiles before processing. After processing, the edge-rind manifests itself on the processed image as a very small dip in brightness just to the left of the peak in the top right-hand plot – a deceptively innocuous feature.
Although we have seen that processing can induce a bright edge or a dark ring on a raw disc which initially does not have either of these features, it is important to note that the width of any edge effects introduced in this way are a function of the processing used and the nature of the starting disc. The processing can draw out embryonic edge-rind in the raw image, but this edge-rind has been shown to be a function both of aperture and of wavelength. Any new edge created solely by the processing will be invariably independent of these two parameters. This is a key point and shows that the processing cannot be the root cause of the edge-rind effect, although it can play a part in its visibility in the final image.
As mentioned previously, edge-rind can be particularly bad for Mercury and this is especially true when the phase is small. Figure 15 shows how different levels of processing brighten the edge and bring out the rind, which is just visible on the sharp limb edge in the unprocessed stacked image at extreme left. The rind becomes very obvious, even at low levels of wavelet processing in Registax. In this figure the processing applied to the far right-hand image is less than that applied to the Mars images in Figure 13; even so, the severity of the edge-rind is much worse.

Explanations of the cause of edge-rind
Diffraction
The main observational characteristics of edge-rind lead us to the conclusion that its primary cause is the diffraction of light at the planet’s sharp limb. Here, where there is an abrupt change in brightness compared to the background sky, when the planet is observed with the finite aperture of the telescope, diffraction effects generate a set of dark and light arcs inside and outside the hard edge of the limb.
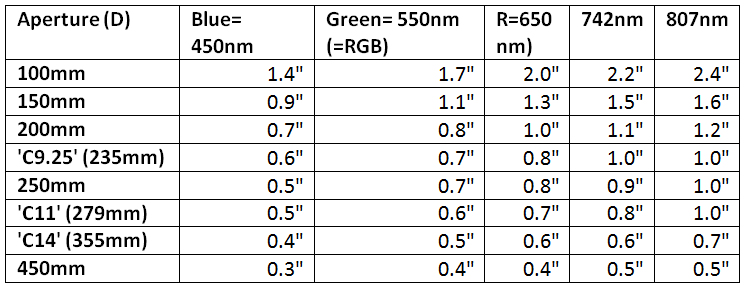
As discussed previously, the width of the edge-rind – measured from the limb of the planet to the middle of the dark arc – seems to be about 60% of the Airy disc diameter. Consequently we can write an equation similar to that for the Airy disc and generate edge-rind widths for different telescopes (Table 1 below).
A diffraction-based theory might also explain why some telescope designs seem more prone to edge-rind issues than others. The larger the central obstruction, the more light is thrown out from the Airy disc into the surrounding rings of the diffraction pattern (especially the first ring) and the more prominent the diffraction effects – as seen in Figure 16a (generated using Aberrator 3.0). Schmidt– Cassegrain telescopes, with their large central obstructions, do seem more prone to edge-rind effects than Newtonians. Refractors should be the least affected of all, although unfortunately since they are not widely used for planetary imaging, due to their limited aperture, there are few images to check this on.

In a similar way to that just described for the relative size of the secondary mirror, common optical faults such as spherical aberration will also push light out of the Airy disc and into outer rings – potentially leading to worse diffraction effects and worse edge-rind. Spherical aberration has a similar impact on the in-focus diffraction image as increasing the secondary size, as can be seen from comparing Figures 16a & 16b. It should be said that neither secondary size nor degree of spherical aberration is expected to change the width of any edge-rind, just its intensity.

A diffraction-based hypothesis for edge-rind can explain many of the observations already outlined: the aperture dependence, the wavelength dependence, the constant angular size, the independence from the planet size on the chip, as well as the outer bright rings and secondary inner dark rings. This explanation is not the whole story however – if it was, the rind would be ever-present on the whole of the hard edge, more clearly defined when the seeing is better and less well defined when the seeing is poor. This is not the case; the severity varies, being better defined when the seeing is good but also seeming to be worse on some days than others, even though similar levels of detail are seen. In addition, often only part of the hard edge of Mars is affected, the rind being limited to discrete portions of the limb. These locations on the edge and the severity can change from session to session, and sometimes during a session itself.
Other possible influencing mechanisms
What phenomena in conjunction with diffraction might explain the variation in the local severity of the edge-rind and the session-to-session variation? A number of possible candidates, outlined below, are worthy of further discussion.
Edge-flutter
A plausible theory for the creation of edge-rind is that it occurs in a common type of poor seeing, which is characterised by the sharper non-terminator limb rapidly fluttering in position, or the occurrence of frequent image-doubling where two or more distorted overlapping part-images are present at the same time. Directionality of the seeing might mean that one orientation of the limb suffers flutter effects whilst another area does not. Is it possible that the edge-rind becomes apparent in the final processed image when the amplitude of the seeing-induced ‘edge flutter’ equals the diffraction-related distance, i.e. 60% of the Airy disc diameter? When this happens the seeing effects and the diffraction effects might ‘resonate’ to make the artefact more visible in the final image at the location of the fluttering.
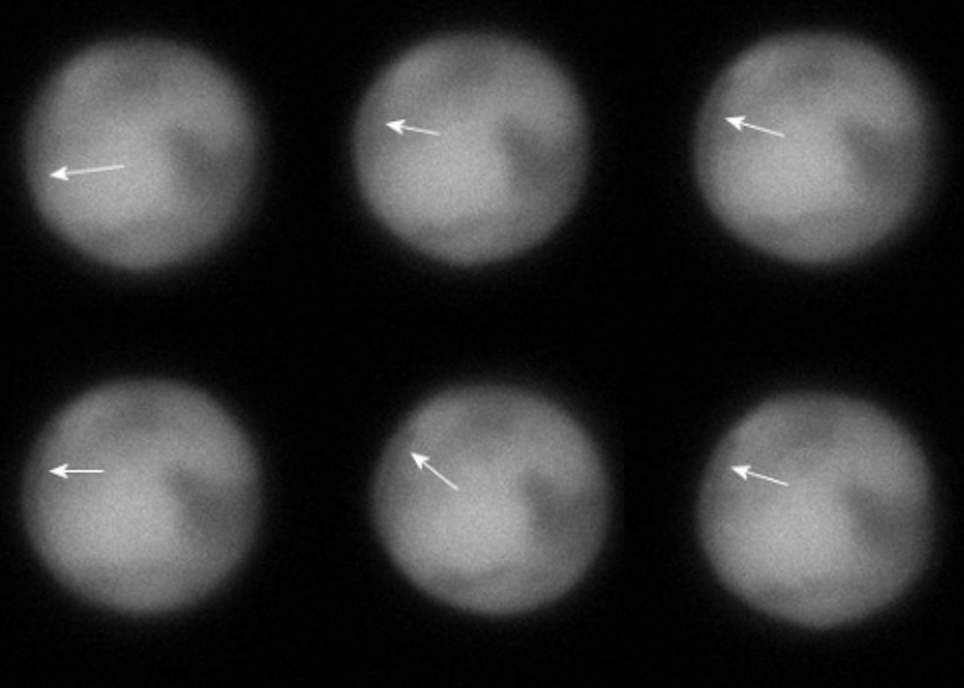
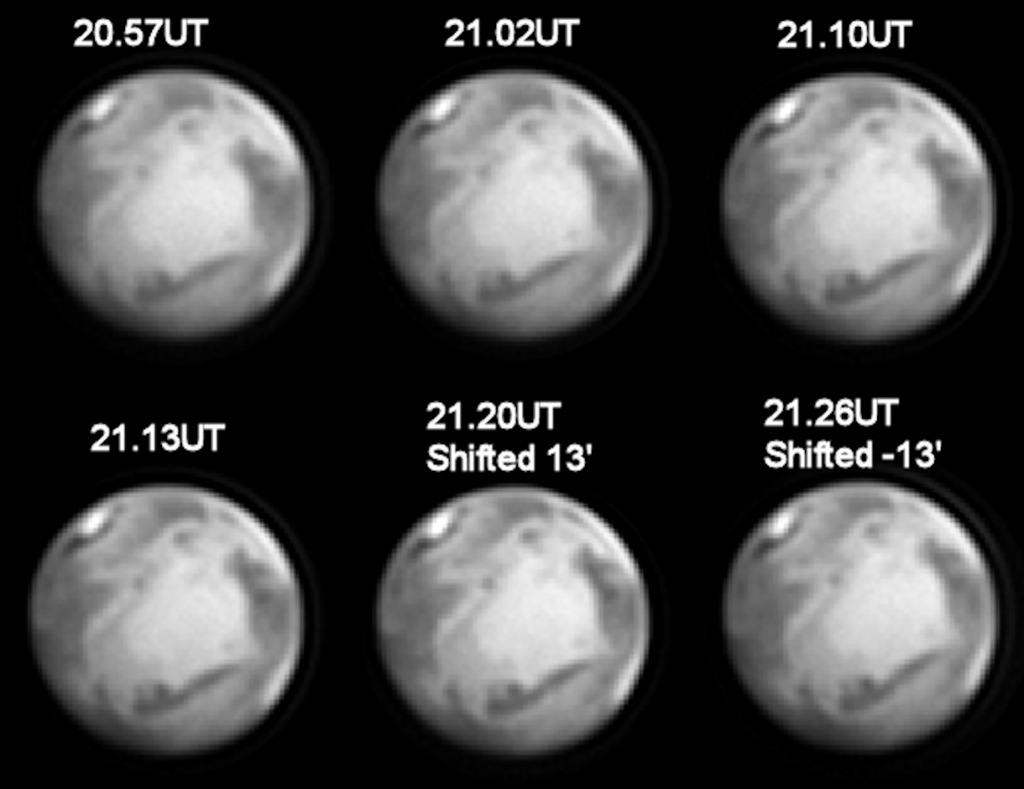
Several videos for which bad edge-rind was visible in the final image were carefully analysed using SER Player, by slowly stepping through the videos in the originally recorded order, looking for doubling and flutter. Although there was much image distortion and regular doubling of images, there was no evidence of flutter, or overlap of doubled images, of an amplitude regularly matching the rind width. Instead, multiple raw frames were seen where embryonic edge-rind appeared, independent of any doubling (Figure 17). Thus, it seems unlikely from this that such flutter resonance plays a major part in the severity of edge-rind.
Atmospheric effects & tube currents
Poor atmospheric seeing, where you are imaging though a turbulently mixing column of air composed of different densities, and convection currents inside the telescope (tube currents) are well-known issues affecting the ability to resolve fine detail in planets. Such effects have often been blamed for causing edge-rind and although the primary cause is diffraction, seeing may play a part in both the variability and visibility of the rind.
Fortunately, it is relatively easy to devise a controlled study of how changes in the quality of the seeing affect the visibility of the edge-rind during an imaging session. We know that the quality of the seeing varies from moment to moment, giving a variation from one frame to the next in the sharpness of the planetary features present. Using processing software we can take a video and put the frames in quality order – from the clearest to least clear. This effectively sorts the video into an order matching the quality of seeing, with the best seeing at the start of the video and the worst at the end. Using the video processing software PIPP, one can select portions of a video ordered this way and pick sequences with identical numbers of frames, creating a set with good seeing, a set with bad seeing and a set with intermediate seeing. These can then be aligned and stacked in Autostakkert! and processed identically in Registax to pull out surface details and draw out edge-rind. This allows us to see if there is a link between seeing and the visibility of the edge-rind.
As the dependence between seeing and the prevalence of edge-rind is such an important aspect of this investigation, videos from five separate sessions with different types of seeing for each were analysed. The results from these analyses of Mars videos are shown below in Figures 18a to 18f.
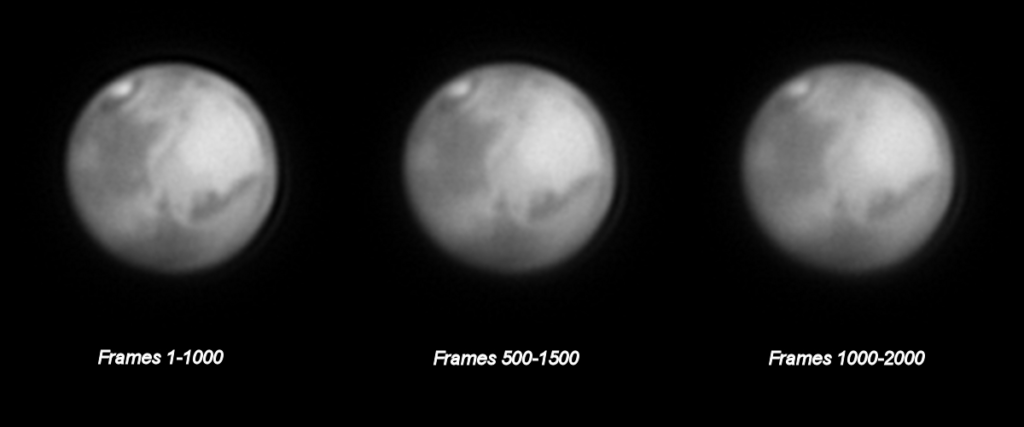
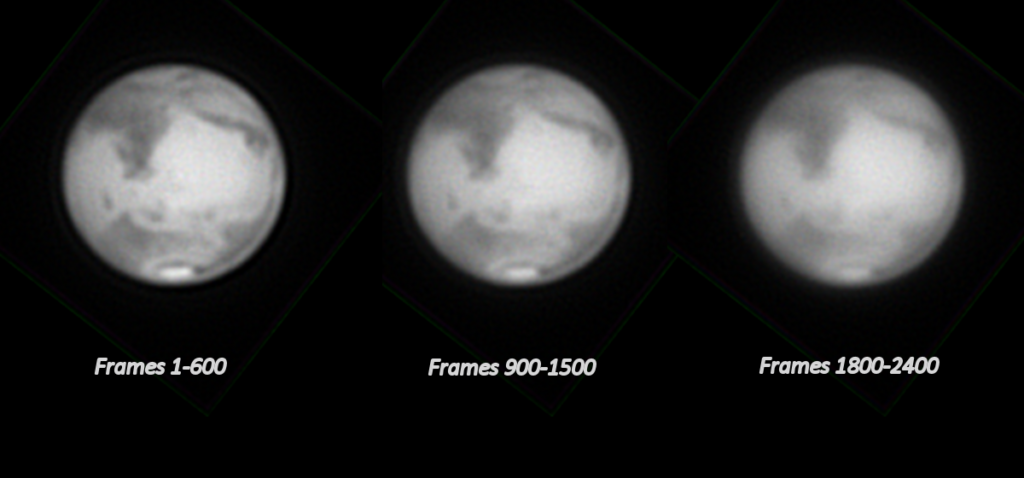
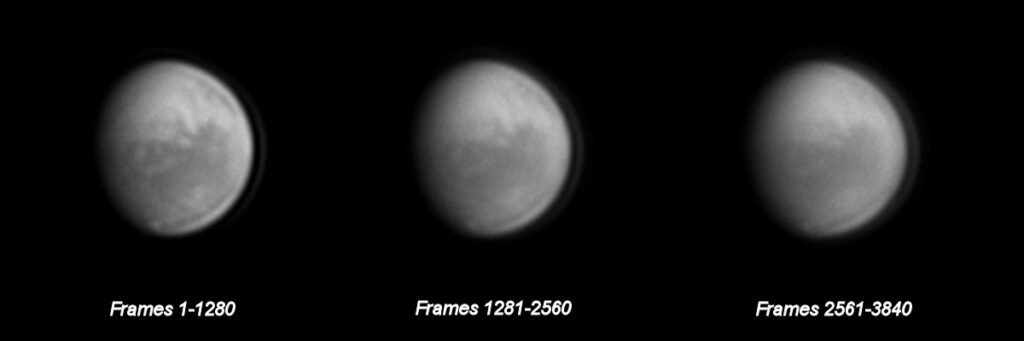
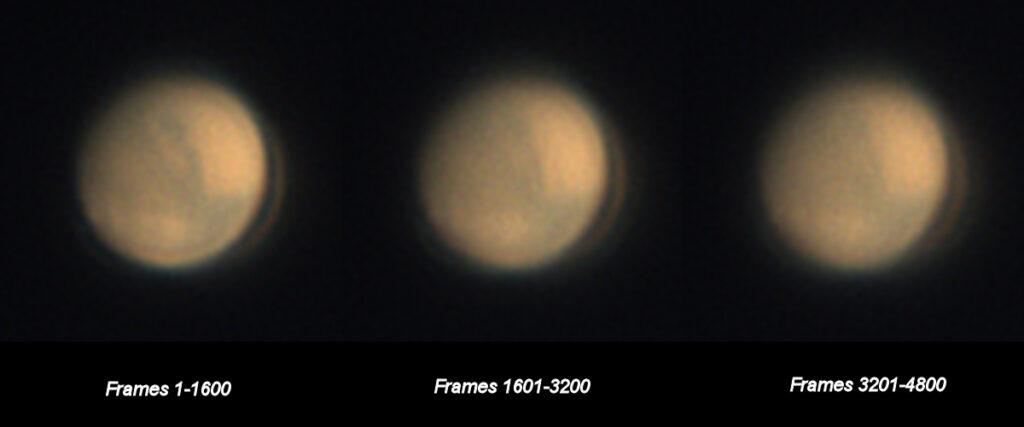
In the figures above we see Mars videos split up in the manner described earlier, going from relatively unaffected by seeing, to significantly affected by seeing. The figures support the position that the better the seeing the more evident the edge-rind.
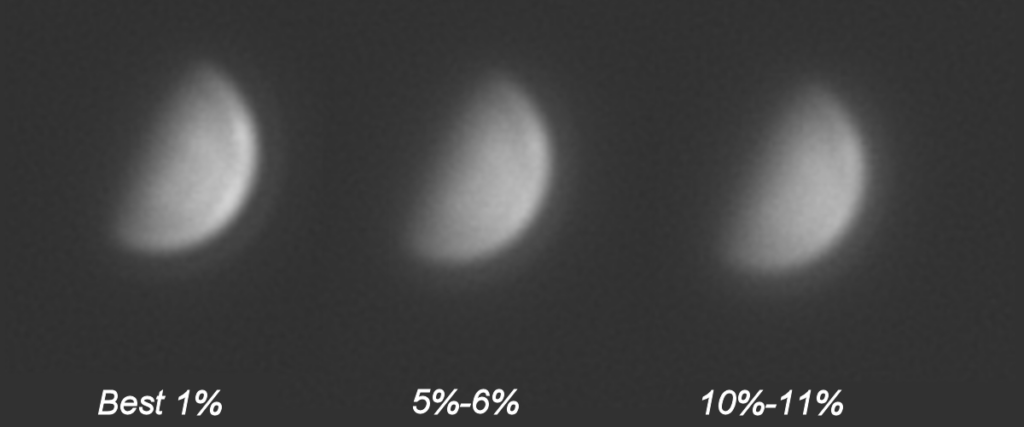
A similar analysis to that described above for Mars was carried out on a Mercury video taken in full daylight in very poor and jumpy seeing (Figure 18e). This is a quite different type of seeing to that typically seen at night-time for Mars. The Mercury video was composed of 230,000 frames which were quality-sorted to effectively put the video in order of seeing. The best 1% of frames were picked and processed; the result was compared with images based on the same number of frames but 5 and 10% of the way through the quality-sorted frame set. Each image was processed identically in Registax. This illustrates, as before, that the visibility of the edge-rind increases as the seeing improves.
The results presented above, clearly show that the edge-rind is most evident in the images taken in the best seeing conditions – where the surface detail is also the clearest. They also show that the visibility of the edge-rind decreases in a progressive fashion in the same way as the visibility of the detail, implying that the seeing is not its cause. If the edge-rind visibility was sometimes more apparent with worse seeing rather than less apparent, this might imply that some types of bad seeing ‘encourage’ the occurrence of edge-rind and there is some causal link. This has not been found to be the case so far.
It may be that differences in the visibility of the edge-rind that are seen session to session are related to how well defined the Airy pattern is at the time of imaging. Seeing that softens or partly disrupts the Airy disc pattern during video recording does not eliminate the edge-rind in the final image, as the pattern can be retrieved through sharpening techniques. It could be, however, that in seeing where the Airy pattern is completely broken up, the diffraction pattern cannot be recovered through sharpening and the edge-rind is absent. More investigation is needed to explore this link between the visibility of the edge-rind and how well-defined the Airy pattern is at the time of imaging.
Variation in ‘hardness’ of the planet edge
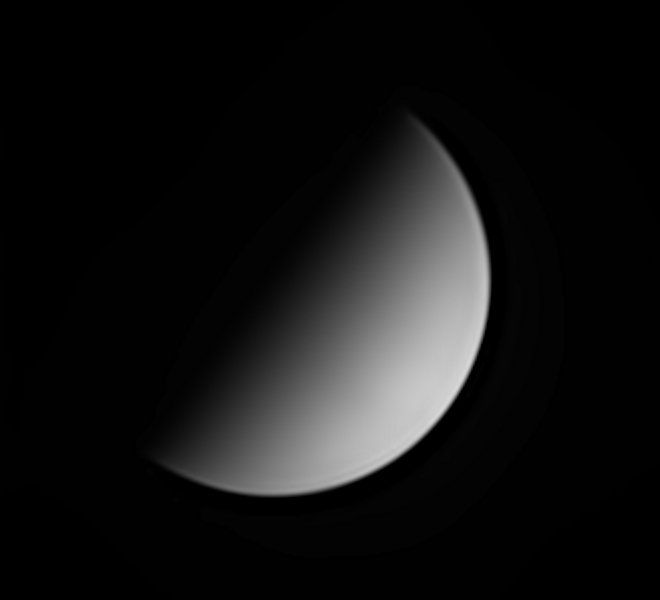
Anecdotal evidence suggests worse edge-rind when Mars is close to quadrature compared to when it is at a fuller phase. There are also suggestions that Mercury actually exhibits worse edge-rind than Mars, especially when at dichotomy or at crescent phases (Figure 19a). Mercury images, interestingly, seem to have edge-rind that varies in intensity from session to session but invariably covers the full length of the sharp limb edge – with none of the local variation seen with Mars images.
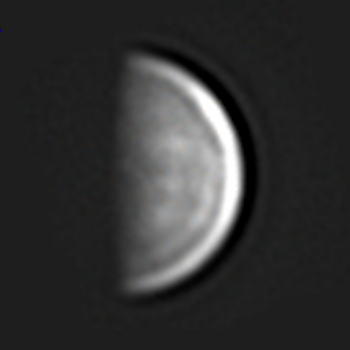
Although showing plenty of surface detail in the middle, the Mercury image in Figure 19a shows particularly bad edge-rind when processed in the same manner as the Mars images in Figure 14; it would have to be processed more gently to be a useful image. It is of interest to see what some of the raw frames look like from the video used to create Figure 19a. These, shown in Figure 19b, clearly show signs of edge-rind in the raw unprocessed individual frames – showing again that although processing may draw out the edge-rind, it is not the primary cause.

In trying to understand why there is worse edge-rind as the phase decreases, we have taken Mariner 10 and Messenger images for Mercury, and Hubble Space Telescope images for Mars, and plotted the brightness distribution across the disc at different phases. At the right-hand end of Figure 20a it is shown that Mars at gibbous phase, close to quadrature, has a limb edge which is significantly brighter than the planet’s average brightness. At opposition, however, the brightness variation across the disc is much more uniform. This same effect is seen in the Mercury plots, becoming more pronounced still as the phase decreases. The reason this asymmetry affects the outcome of image processing remains unclear but, whatever the cause, the effect on the edge-rind visibility after processing is quite pronounced.
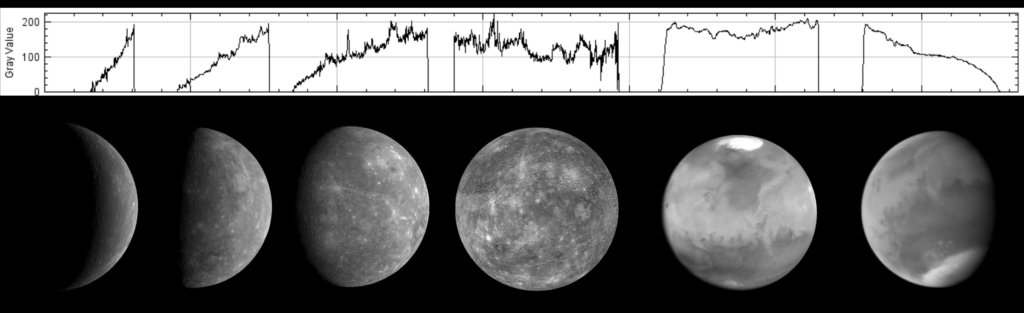
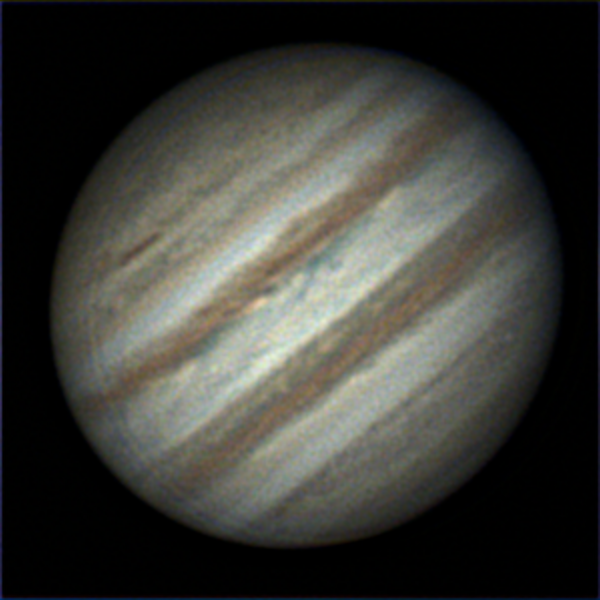
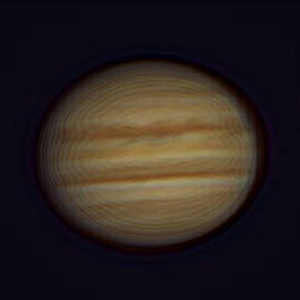
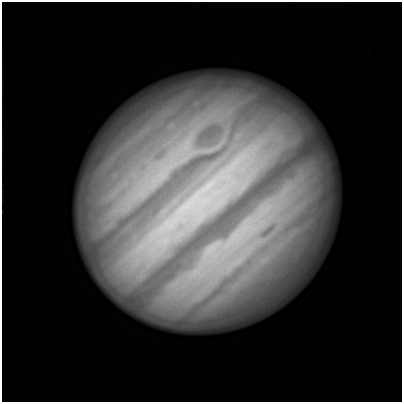
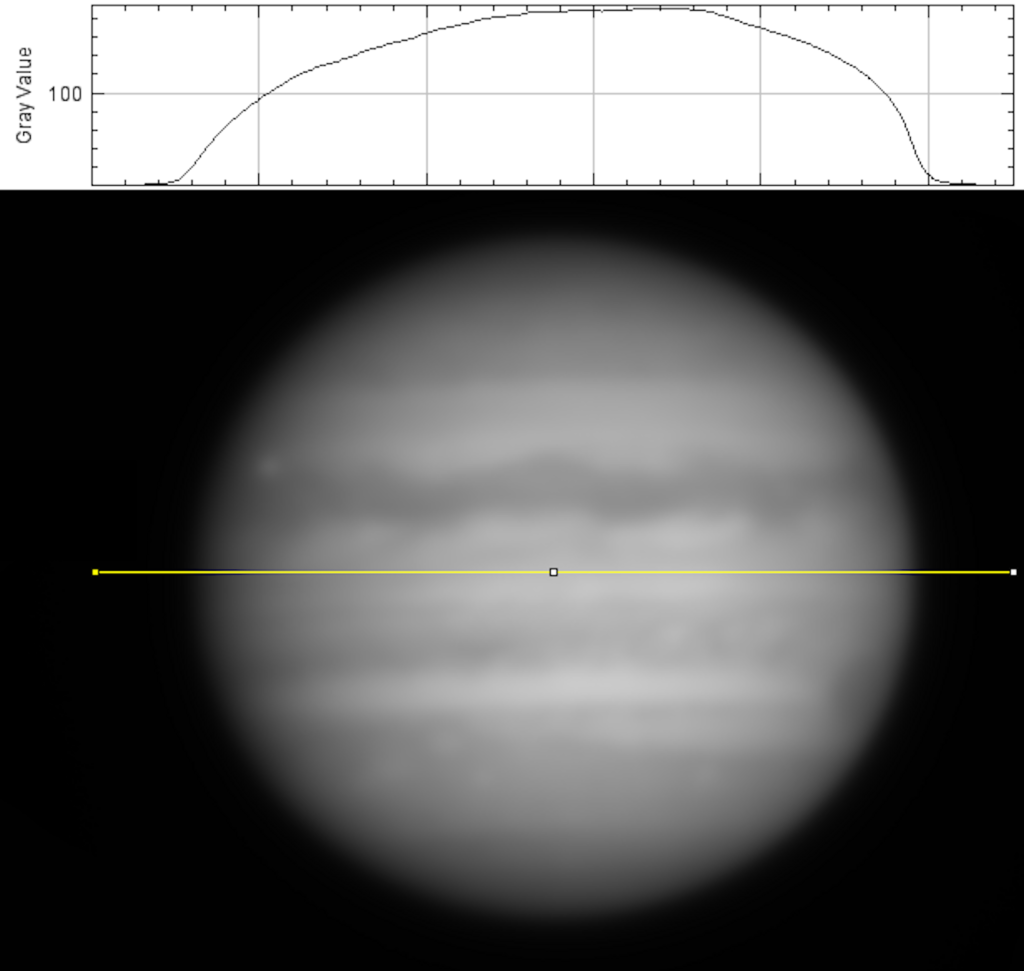
The plots in Figure 20a show the soft tail-off in brightness on the terminator side, when any significant phase is seen. Edge-rind is never seen on this side because the abrupt change in brightness needed to generate diffraction effects is absent. It is for this same reason that the gas giants, Jupiter and Saturn, do not generally show diffraction-related edge-rind. Light is able to penetrate quite deeply into the atmospheres of these planets, causing significant limb darkening and a much more gradual drop-off in brightness at the edges (Figure 20b). Close to quadrature, however, Jupiter does show a noticeably sharper limb on the sunward side – hints of edge-rind can then sometimes be seen here, especially with stronger processing.
Martian dark albedo edge features
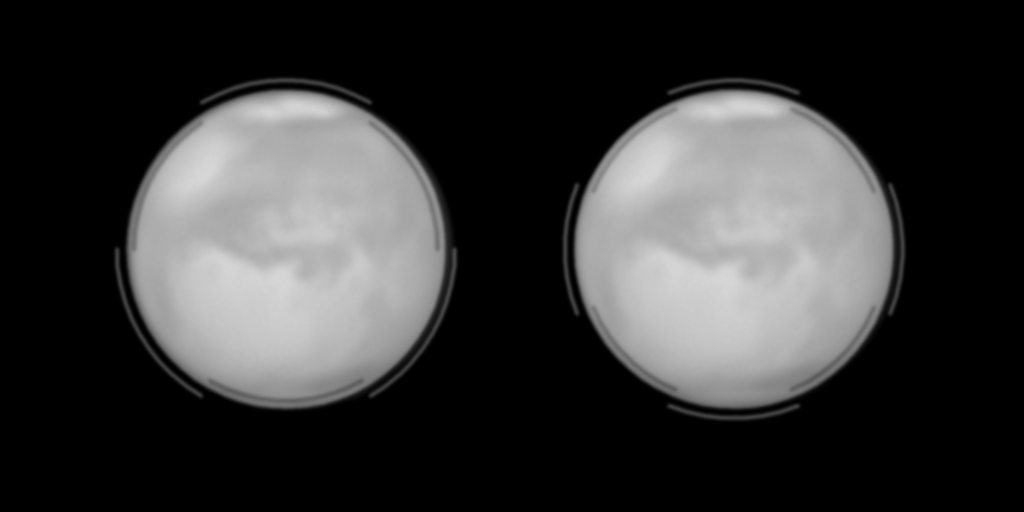
In Figure 21a, we see very similar views of Mars with almost identical edge-rind appearance. The images, however, are taken 24 hours apart in different countries by two different imagers. How can the edge-rind be so similar looking, given how different everything else is? This hints that edge-rind location might have some dependence on the presence of albedo features.
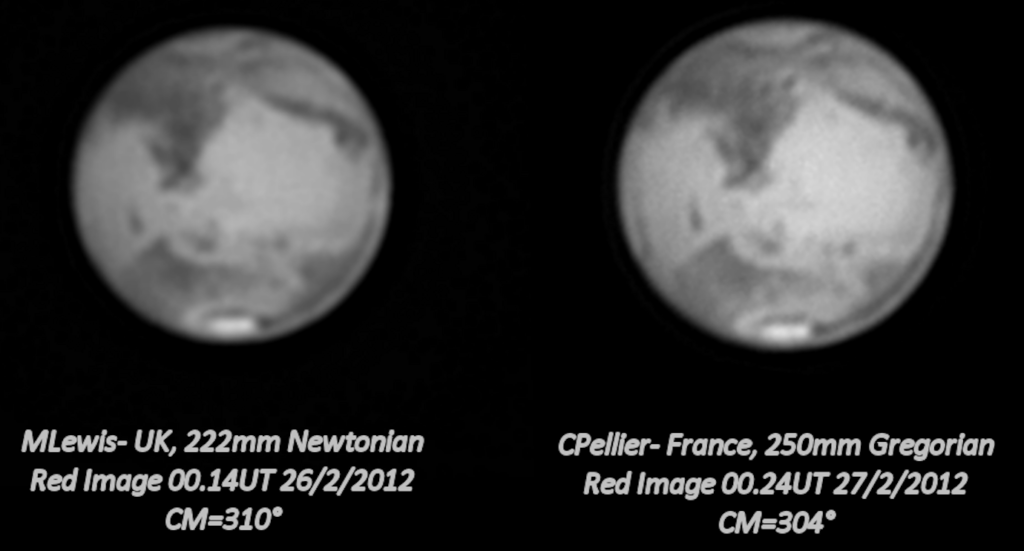
Analysis shows that the predominant dark stripe on the right-hand side of each image is actually the eastern edge of the foreshortened dark albedo feature Mare Acidalium. It is intensified in darkness by the location of the diffraction dark arc, whilst the outer, brighter part of the edge-rind at the very limb hides the more westerly portions of it. At the three o’clock position, Oxia Palus is in the right position to extend the rind a little further upwards. On the left-hand side of Christophe Pellier’s image, the short dark arc at the eight o’clock position is actually the Hyblaeus Extension feature.
Pellier has an image from that same night, taken an hour earlier (Figure 21b). Here the albedo features mentioned above are away from the rind region. The dark arc, although present, is much more subdued on the right side and absent on the left side.

Thus, the darker albedo features on Mars can locally intensify the dark arc, making the rind much more prominent at those locations (or arguably vice versa). Maybe this is commonly an explanation for the local variation in the edge-rind seen on Mars and for why the edge-rind on Mercury, although possibly generally worse, does not have this local variation – Mercury does not have the large, significantly darker albedo regions that Mars has.
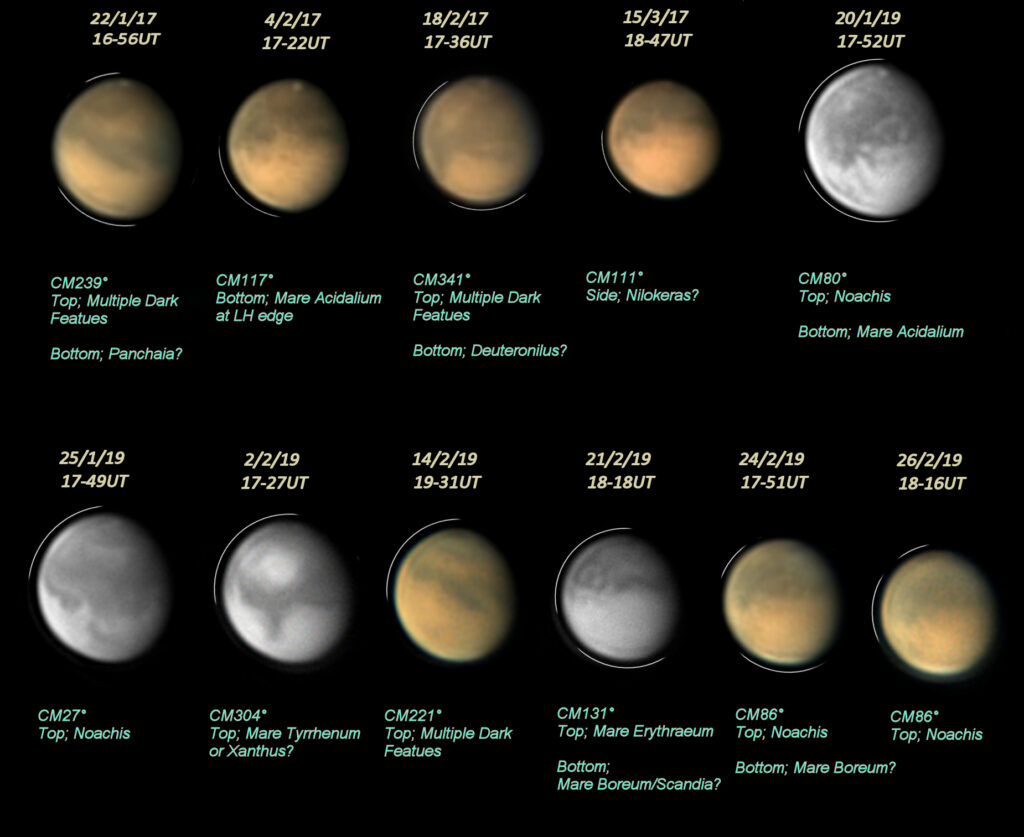
To explore this idea further we can take some of the images seen previously in Figure 12 and see if there is any correlation between the localised edge-rind seen on different dates and the location of dark features at the edge of the disc in the same place. Figure 22 does seems to suggest there might be a link between darker albedo features at the limb and the likelihood of the dark arc of the edge-rind appearing in that area – although this analysis is far from conclusive.
Effect of miscollimation
In the same way that increasing the size of the secondary pushes light from the Airy disc into the surrounding rings, leading to worse diffraction effects and edge-rind, so miscollimation can do a similar thing by imparting asymmetry to the intensity of the ring pattern. In the in-focus Airy pattern seen in Figure 23, for a scope with a 33% secondary, see how misalignment pushes the light from the right-hand side of the inner ring into the left-hand half. It is almost as if the ring pattern is being worsened on the left and improved on the right. Note that as we saw previously with secondary size and spherical aberration changes, it is just the intensity distribution that is changed by miscollimation, not the separation of the rings.

Such an observation might suggest that miscollimation could improve the edge-rind on one side of a planet at the expense of a greater likelihood of occurrence on the other side. The terminator side seems to be fairly immune from edge-rind so one might imagine that purposely misaligning to promote edge-rind on that side, to save it from appearing on the sharp limb, might be a way of reducing the effect. Such a technique might work if it could be done in a controlled fashion without adversely affecting detail in the middle of the disc.
Some limited experimentation on this method has been carried out by the author, which is shown in Figure 24a & b. It suggests some improvement through miscollimation in edge-rind in one direction and a worsening in another. The technique seemed to have little impact on the levels of detail seen on the main disc.
In Figure 24b, the background brightness for the bottom three Mars images in Figure 24a has been boosted, showing the outer bright rings present. These rings get brighter as the inner dark arc intensity decreases (negative shift in collimation) and get dimmer as the dark arc intensifies (positive shift in collimation). This fits in with what we would expect from looking at the diffraction pattern arising from misalignment.

With such clear outer rings seen in Figure 24b, it is tempting to measure the angular distance from the dark arc to the location of the first bright ring on the outside of the edge. This can then be compared with that calculated for the Airy pattern for the same telescope aperture and wavelength (filter) combination. Given that the radius of the first bright ring for the Airy pattern, in radians, is given as 1.635λ/D and the radius for the first dark ring is 1.22λ/D, then the distance from one to the other across the centre should just be the addition of these two values and so be equal to 2.855λ/D. For a 222mm telescope with a red filter (λ=630nm), this works out at 1.67′, a reasonably close match to the value of 1.55′ measured from the image in Figure 24b.
Effect of other aberrations
If the directionality imparted to the Airy diffraction pattern as the result of misalignment is important and can affect the side that the edge-rind is on, then common optical aberrations favouring some sides of the Airy disc over others should also be considered. Figure 25a shows how pinched optics imparts a three-way brightness directionality and astigmatism a four-way directionality to the Airy pattern.
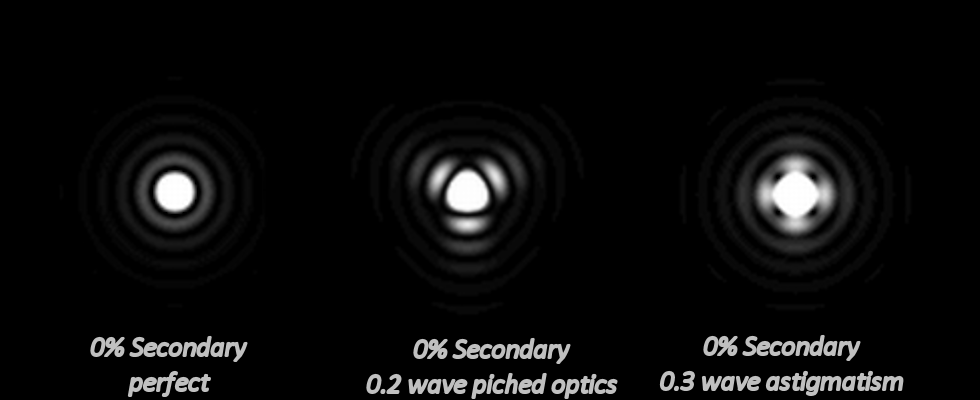
In similar way to that seen for miscollimation, one can imagine such aberrations possibly inducing multiple dark arcs and intermediate bright outer rings on a 120 or 90 pattern around a planet for pinched optics and astigmatism, as shown by the simulation in Figure 25b.
Such an explanation might be the cause of the alternating dark/ light arc pattern seen previously in Figure 10, which could fit with an astigmatism aberration. It may also contribute to the localised dark arc distribution that we tried to correlate with dark albedo features at the limb in Figure 22.
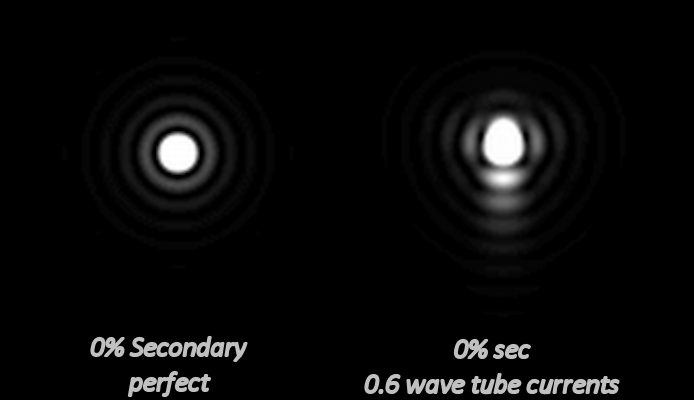
Convectional tube currents can mimic errors in the telescope’s optical surfaces and will almost certainly have a directional nature (usually up/down). Figure 25c, generated in Aberrator 3.0, shows how similar the in-focus diffraction pattern can be to optical misalignment. Again, this might induce similar positional preferences for the edge-rind.
Edge-rind versus seeing for two Mercury videos
During my investigations into the edge-rind artefact I was intrigued by two videos taken of Mercury by Simon Kidd in early 2019, one close to western elongation on 25th Feb. and one close to eastern elongation on 21st April. The former was imaged in very good conditions and has been referred to in earlier sections as it showed particularly bad edge-rind. The latter one in April was imaged in worse conditions and showed some surface detail but there was no sign of edge-rind. As well as differences in seeing the April image had a much higher background brightness due to the amount of haze in the sky and individual images were softer too.
We have already explored the effect of seeing on the visibility of the edge-rind which showed that it seems to be more visible when the seeing is better. To also explore the effects of image softness and background brightness on the visibility of edge-rind I processed the stacks from each session in different ways to see the impact on the visibility of the edge-rind. The results of this analysis are shown below.

The analysis seems to show that the difference in the visibility of the edge-rind on these two occasions is not primarily due to the differences in softness of the stacked image or differences in the contrast between the background brightness and the planet. Attempts to soften the image from 25th February and reduce the contrast with the background to match the stacked image from 21st April cannot seem to wipe out the presence of the edge-rind which always seems to come through with the surface detail.
It is speculated that the differences in visibility of the edge-rind in these two examples are due to differences in how well defined the Airy pattern would be at the time of imaging. Softening the Airy disc pattern using Gaussian blurring is not enough as the pattern can be retrieved through sharpening techniques. If the pattern is completely broken up, however, due to poor seeing then it cannot be recovered through sharpening.
More investigative work on this link between the visibility of the edge-rind and how well defined the Airy pattern is needs to be carried out.
Edge Artefacts on other Solar System Objects
Venusian edge-rind
We have seen how the rocky planets Mars and Mercury can show edge-rind on the sharp limb, whereas planets showing limb-darkening like Jupiter and Saturn rarely show it, except on strong processing. Unlike the gas giants, however, the Venusian atmosphere is very dense and limb darkening is absent. Instead, the planet has a very large brightness change at the limb and this leads to the generation of edge-rind with processing, as seen in Figures 27a, 27b and 27c.

Edge-rind on Pluto?
Images from the New Horizons probe approaching Pluto in the summer of 2015 seen in Figure 28 (https://pds-rings.seti.org/press_releases/pages/PIA19xxx/PIA19693.html) seem to clearly show edge-rind on Pluto and Charon obviously without any intervention from our own atmosphere or tube currents to concern us. The images suggest a uniform unbroken arc on one side and could be a valuable contribution to this investigation.

Something is amiss though- the width of the edge-rind appears to be different for Charon and for Pluto. In addition, the LORRI camera aboard the spacecraft has an aperture of 208 mm giving a predicted rind width of ~1.33″. Edge-rind measurements of the Pluto images in Figure 28, however, give much wider rind widths of 2.5″ (June 25) and 3.4″ (June 27). The camera aboard actually has a resolution of only 1.02”/pixel which would barely be able to resolve any rind at the predicted width. It is likely that the rind seen here is not diffraction related but instead an effect generated during the image processing. Going back to the raw images taken on the same days, in Figure 29, we see no sign of the edge-rind and the author’s own processing using Astra Image deconvolution brings out the details without creating any dark arc.
It seems likely that what we are seeing here is another examples of where processing has created a spurious edge to a disc and is not edge-rind seen in the absence of an intervening atmosphere or tube currents.
Edge Artefact on Lunar Images
Are edge diffraction effects also seen with images of the Moon, the surface of which is usually covered with bright sunlit areas immediately adjacent to very dark shadow features? The answer is a definitive ‘Yes’; diffraction features abound. Features are especially evident if the processing is ‘pushed’ to compensate for poorer seeing, longer wavelength filters are used, or the aperture is small. The high contrast of the lunar terrain means the processing required on Moon images is often more gentle than on planetary images. This helps reduce the visibility of diffraction artefacts, as does the generally lower image scale used for lunar imaging.
Below in Figures 30a to 30c are shown high resolution lunar images taken by Bill Leatherbarrow with a 300mm reflector using a 742nm IR filter. These have been processed at higher than usual levels to bring out diffraction effects. We see numerous examples of bright rings running parallel to bright edges with a constant separation between the edge and the ring of approximately 0.75″ matching the calculated edge-rind distance for this scope and filter combination. Further on we see possible examples of dark bands akin to edge-rind and again the distance of 0.75″ between the bright edge and the dark band matches our empirically derived edge-rind formula of 0.6x the Airy disc diameter.


Niall MacNeill provided me with an illustrative comparison for the Moon, with two images taken with very similar lighting conditions. One was taken by himself with a C14 (355mm aperture) and a mono camera with RGB filters, whilst another was taken by Georges Lucotte with a 180mm Mak and IR filters. The latter shows much larger and more obvious diffraction effects around the features, due to the later airy disc arising from the smaller aperture and use of IR wavelengths.

Bottom = 180mm Maksutov with IR filter in similar seeing by Georges Lucotte
Given the destructive nature of diffraction effects on the quality of lunar images, it is obvious that the least affected images will be obtained with large scopes on the nights of good seeing, when the processing only needs to be lightly applied. In those conditions it is best not to use IR filters but to image in shorter wavelengths, such as Red or even Green, where the Airy disc will also be smaller.
Reducing edge-rind in the original data
As already detailed in the article, a number of aspects potentially under the imager’s control will influence the severity of the edge-rind present in the raw data. These include telescope aperture, secondary size, imaging wavelength and the presence of optical aberrations. For many imagers, however, such aspects are actually difficult to change and it should be considered whether there are other techniques that might be easier to alter which will help in reducing the edge-rind in the recorded data.
Under the section ‘Effect of miscollimation’ the idea was discussed of purposely misaligning a telescope to produce an asymmetric Airy pattern that may boost the diffraction pattern on one side and reduce it on the other side. Such a method may hold some promise, as shown earlier in Figure 24a and 24b, but could result in deterioration in image quality and loss of detail in the main planetary disc.
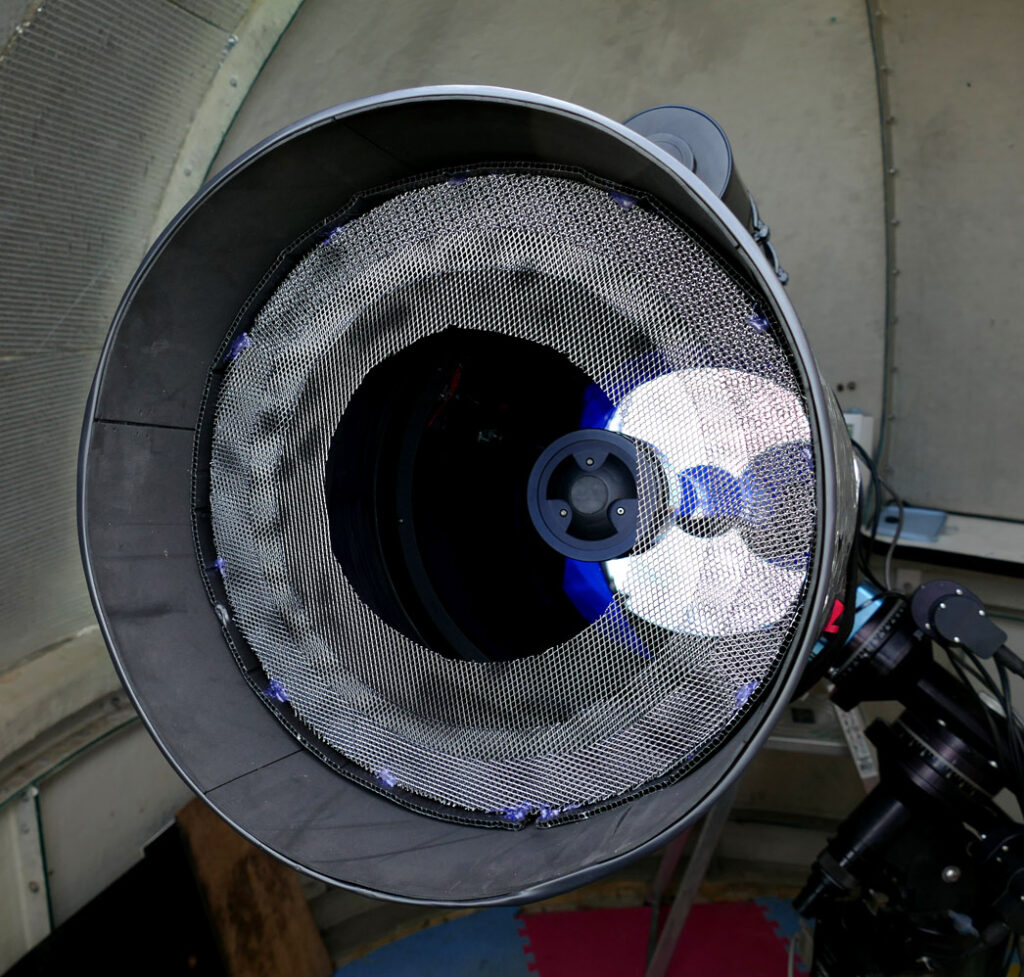
Another method that may help with the issue is occasionally discussed in telescope forums, but backed up by a relatively small amount of empirical evidence. The technique uses a gauze, graded apodising mask to effectively soften the edges of the telescope aperture. Use of such an apodising mask should soften and spread out the Airy pattern, reducing contrast between bright and dark rings and so reduce the edge-rind effect. Experimentation by planetary imager Simon Kidd on Mars images in early 2019 showed little benefit in the use of such a mask with a C14 telescope and he concluded that the edge-rind might have actually been made worse. He speculated that the mask effectively reduced the aperture and made the secondary diameter larger, offsetting any benefits due to the softening of the edge of the aperture. His home-made apodising mask is shown in Figure 31.
Experienced visual observer David Gray, on the other hand, finds some benefit from the use of such a mask to make observations for mid-scale seeing. It seems that more experimentation is needed in different seeing conditions to check if the same seeing dependent benefit holds with imaging.
Techniques to reduce edge-rind in the final image
The simplest approach in dealing with edge-rind is to leave it in place, letting it stand as a tacitly acknowledged artefact. If this is felt to be unacceptable, however, a number of techniques exist which can be used to try to remove it.
Edge retouching
A conceptually simple method is to retouch the dark arc in Photoshop using the clone tool – sampling pixels from the adjacent unaffected area and using these to paint over the dark arc. Although this is in principle a simple method, great skill is required to wipe out the edge-rind without creating an even more visually disturbing feature. One also risks introducing personal bias and creating local features where none existed before.
Dual-process method
Easier to accomplish and less prone to personal bias, the dual-process method involves first creating two images with different levels of processing. One image is processed as normal to maximise detail in the centre of the planet, whilst a second is more softly processed – showing less detail but also less edge-rind. In Photoshop, the more detailed image is then placed in a layer above the softer image and the two are aligned. The reduction in edge-rind is achieved by erasing away the edges of the sharper disc, to reveal the edges of the more softly processed disc in the layer below that shows less rind. A feathered circular selection tool can be used to generate an arc-shaped selection area which covers the whole affected edge. This allows one to erase the offending area in one go. The softer bottom layer can then be adjusted to show through at an identical brightness to almost perfectly match the surrounding area on the top layer. Simon Kidd has been using this technique to some considerable success on Mercury images and the method is shown below in Figure 32a.

Use of Winjupos derotation
Niall MacNeill proposes an innovative technique to help with edge rind that you can read more about on his astrobin page. In this method he uses a secondary image taken after his main image, if before opposition, or before his main image if after opposition. At the processing stage this secondary image is then derotated in Winjupos to match the timing of the main image. Such an action moves any edge-rind around the harder, non-teminator, limb and out of sight! He then uses this corrected secondary image as a layer under his main image and blends the two with feathering so that the main image uses the corrected edge from the secondary image.
You can see a before-and-after image using this method, below, from Niall:

Spin blur masking
The author has developed a method that uses the planet itself as its own radial mask to reduce the severity of the rind. Therefore, if the edge-rind is worse, the technique acts more strongly to decrease the brightness of that rind. Local intervention or decisions on where to apply a correction are not needed, as the method automatically chooses the local degree of correction itself. It works best with Mercury, where the edge-rind is even along the edge. Figure 33a illustrates the method, which is achieved in an image editing program like Photoshop or PaintShop Pro.
NOTE: A much fuller description of the technique of spin blur masking to reduce the edge rind on Mercury images is given in my dedicated webpage, which you can find here. The information given below is the original summary of the method.

The method involves a number of steps whose main ones are detailed below:
- Start with edge-rind affected image of Mercury
- Use the Radial Blur tool at max strength and max rotation to make a spin blurred version of the image- alter the position of the centre of rotation to ensure centre of rotation of the spin matches the exact centre of the planet – see Figure 33b. When correctly chosen the spun image will have the same diameter as the original planet.

- If the radial blur can only do 90° maximum spin then repeat the spin process to produce a more rotationally even disc
- Draw a circular selection around the centre of the blurred disc and perform a Gaussian blur here with a large pixel size to even out the hole in the centre. You should now have an even centre with a brighter edge to the disc
- Invert the blurred disk and use it as a mask layer acting on the original image of the planet. Carefully line up the mask with the planet so the edges match
- The edge of the mask will be darker and so reduce the opacity of the planet’s rind whilst in the centre it will have less effect.
- Place a black raster layer behind the planet and mask layer. Then where the mask is darker the planet will be lower opacity showing the black more and so dimming the edge-rind
- Alter the opacity of the mask to fine tune the degree of edge correction
Background brightness method
We have seen that planetary processing methods commonly used to bring out surface details on the bulk of the disc can produce unwanted edge artefacts, exaggerating any edge diffraction latent in the image. Artificially reducing the edge contrast by brightening the background can theoretically reduce this effect and lessen the degree to which edge diffraction effects are amplified in the processing. Simon Kidd has been exploring this technique on Mars images, with some encouraging results, by pasting an image of the planet onto a bright background with a small amount of dark space around it. This seems to cause the wavelet processing to act less strongly on the edge, so that diffraction-induced edge-rind remains ‘unamplified’. The method is illustrated in Figure 34.

The method needs care in setting up, but the principle seems to work and one day it could be incorporated into planetary processing software as an automated process.
Summary
At this point, it might be useful to sum up a little, listing all the factors believed to influence both the width and the severity of the edge-rind.
Width factors
Angular width (in radians from limb to middle of dark arc) = 0.6 × 2.44λ/D . Hence the factors affecting width are:
– λ, wavelength (width proportional to wavelength, so wider with longer wavelengths);
– D, telescope aperture (width inversely proportional to aperture, so wider with smaller apertures).
General severity factors
– Secondary size: edge-rind worse as this increases as percentage of total aperture;
– Spherical aberration: edge-rind worse if optics are more affected by spherical aberration;
– Brightness distribution: edge-rind worse if brightest part of planet is at the sharp limb rather than the middle;
– Degree of wavelet processing or unsharp masking: edge-rind more visible if a higher amount of processing is used;
– Seeing in general: edge-rind worse in good seeing as it is seen as ‘real’ detail by Autostakkert!/Registax.
Local severity factors
– Miscollimation: can either make the effect better or worse, depending on which side the edge-rind is on relative to miscollimation direction;
– Astigmatism: thought to impact uniformity of edge-rind;
– Pinched optics: thought to impact uniformity of edge-rind;
– Dark albedo features close to the edge of the planet can accentuate the dark arc.
Concluding comments & acknowledgements
Little has been previously written on this rather specialised aspect of planetary imaging. Even if you are not an imager, however, the author hopes that you have found the investigation of interest. Although it seems certain that diffraction is at the heart of the effect, other aspects of the optical set-up, seeing and processing methods have influences, and I hope others might be able to add to the understanding in time with further experimentation and analysis.
I would like to thank those planetary imagers who have helped me with this article and made suggestions. Thanks in particular to Simon Kidd, with whom I had much useful discussion and who supplied many helpful images – particularly of Mercury. In addition, a special thanks to Clyde Foster for allowing me to use many of his fine Mars images to illustrate key aspects of this investigation. Thanks also to Bill Leatherbarrow, Christophe Pellier, A.Wesley and Tiaan Niemand for their invaluable images. Finally a big thanks to David Arditti and Richard McKim of the BAA for valuable advice and help in writing this article and providing key analysis.